Creating Custom Fields In Navicat BI: Type-Changed Fields
Jul 11, 2024 by Robert Gravelle
Back in the sneak peek at Navicat 17, we were introduced to a couple of new Business Intelligence (BI) features, namely Chart Interaction and Calculated Fields. It bears stating that Calculated Field are not the only type of custom field available in Navicat BI. In fact, there are five: Type-Changed, Concatenated, Mapped, Custom-Sorted, and, of course, Calculated. This blog will lay the groundwork for adding custom fields to your charts, starting with Type-Changed Fields. Over the next several weeks, each blog will cover a different field type. As in previous blog installments, we’ll use a data source that connects to the free “dvdrental” sample database.
Here’s the SELECT statement that fetches sales for each movie category:
SELECT
  c.category_id,
  c.name,
  p.amount,
  r.rental_date
FROM
  payment as p
    LEFT JOIN
      rental AS r on p.rental_id = r.rental_id
    LEFT JOIN
      inventory AS i ON r.inventory_id = i.inventory_id
    LEFT JOIN
      film_category AS fc ON i.film_id = fc.film_id
    LEFT JOIN
      category AS c ON fc.category_id = c.category_id
ORDER BY c.category_id;
It is similar to the query that we saw in the previous tutorial on charts, but with two important differences:
- the field list includes the rental_date
- the query doesn’t aggregate sales by category
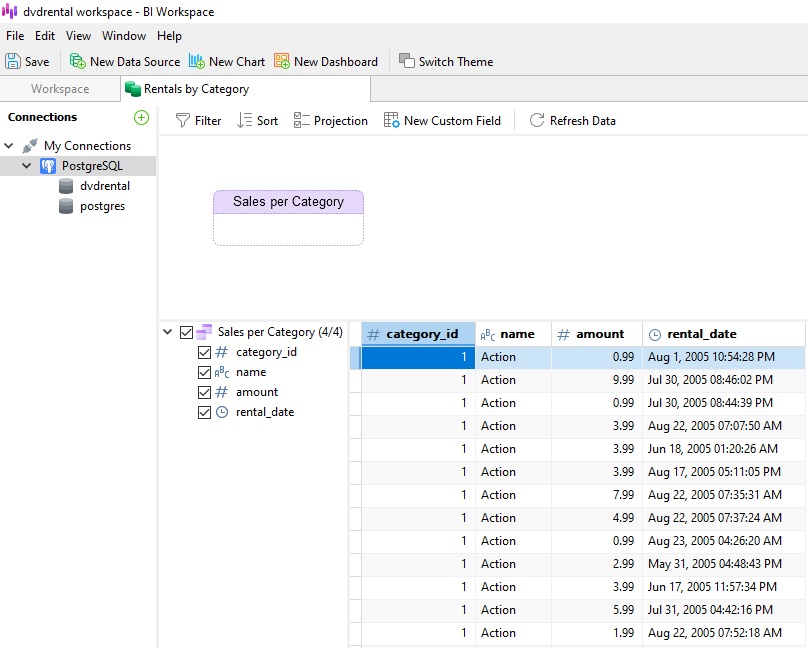
We can see that the rental_date field contains a DateTime:
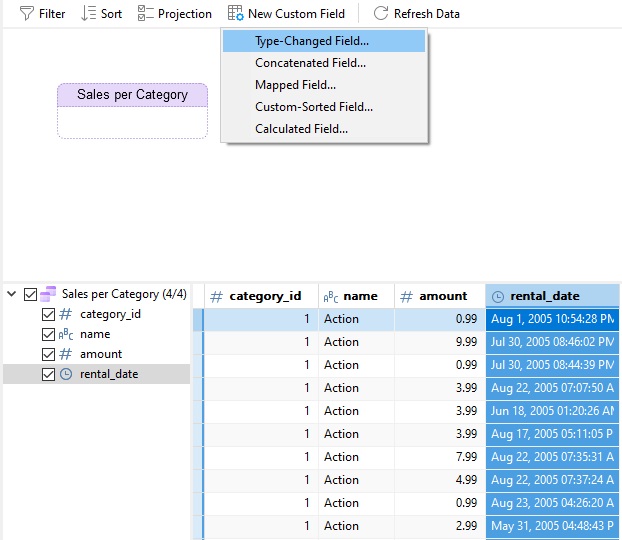
Now suppose that we’d like to remove the time portion of the dates. We could edit the underlying query, or, we could simply add a new Type-Changed field to the existing data source. To do that, we’ll click on the rental_date header to select it and then click on the New Custom Field button and choose “Type-Changed Field…” from the context menu:
Having selected the rental_date column prior to clicking the New Custom Field button, Navicat knows to make a copy of that field. Let’s call our new field “rental_date_no_time” and make it a Date type:
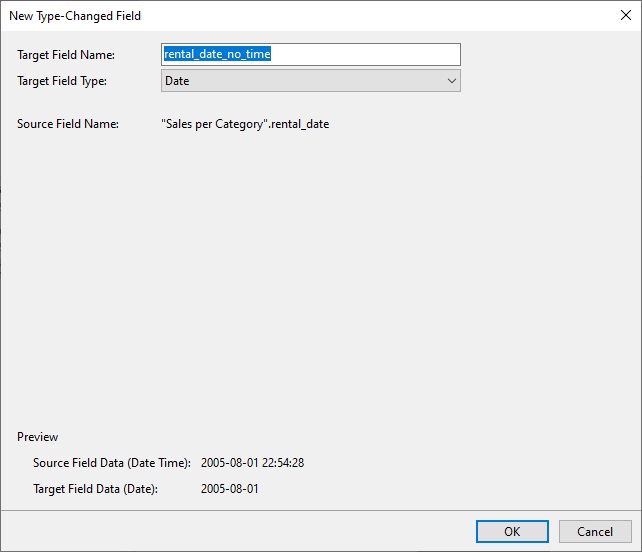
That will allow us to break down sales by date in charts.
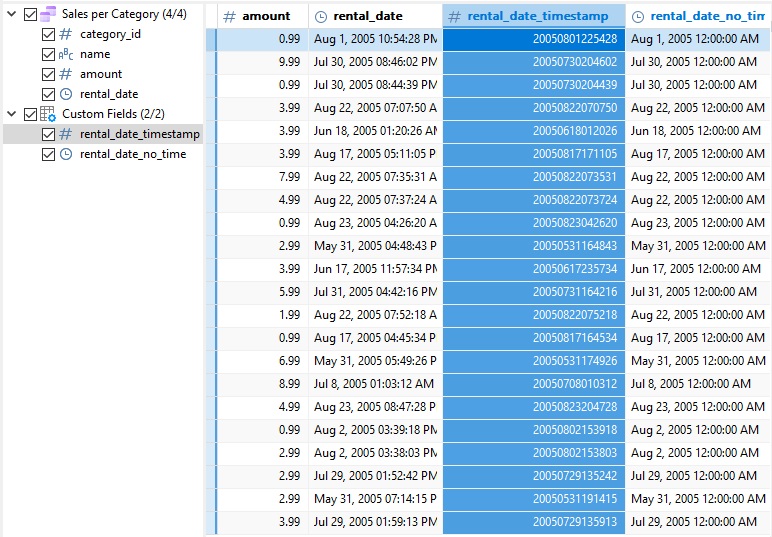
After clicking the OK button, we can see the new field in the field list and data table:
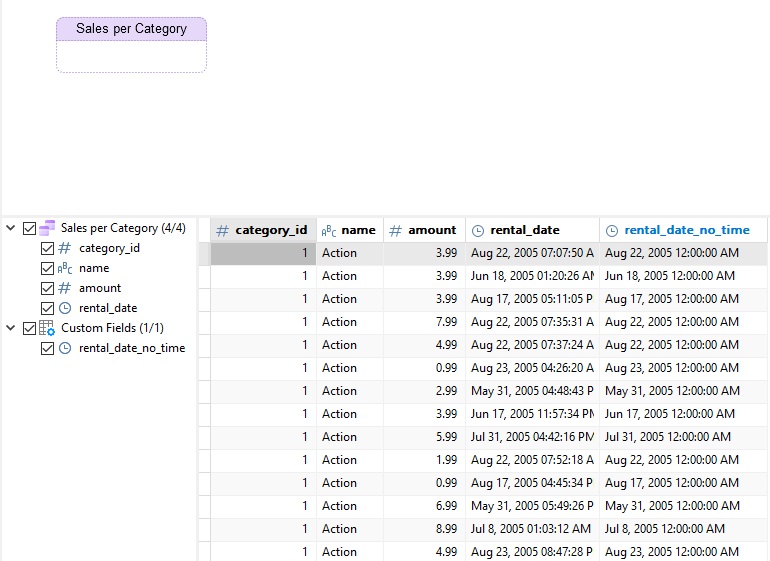
| Quick hint: If you ever need to convert a DateTime field into a timestamp, you can choose Number from the Target Type Field drop-down in the New Type-Changed Field dialog:
|
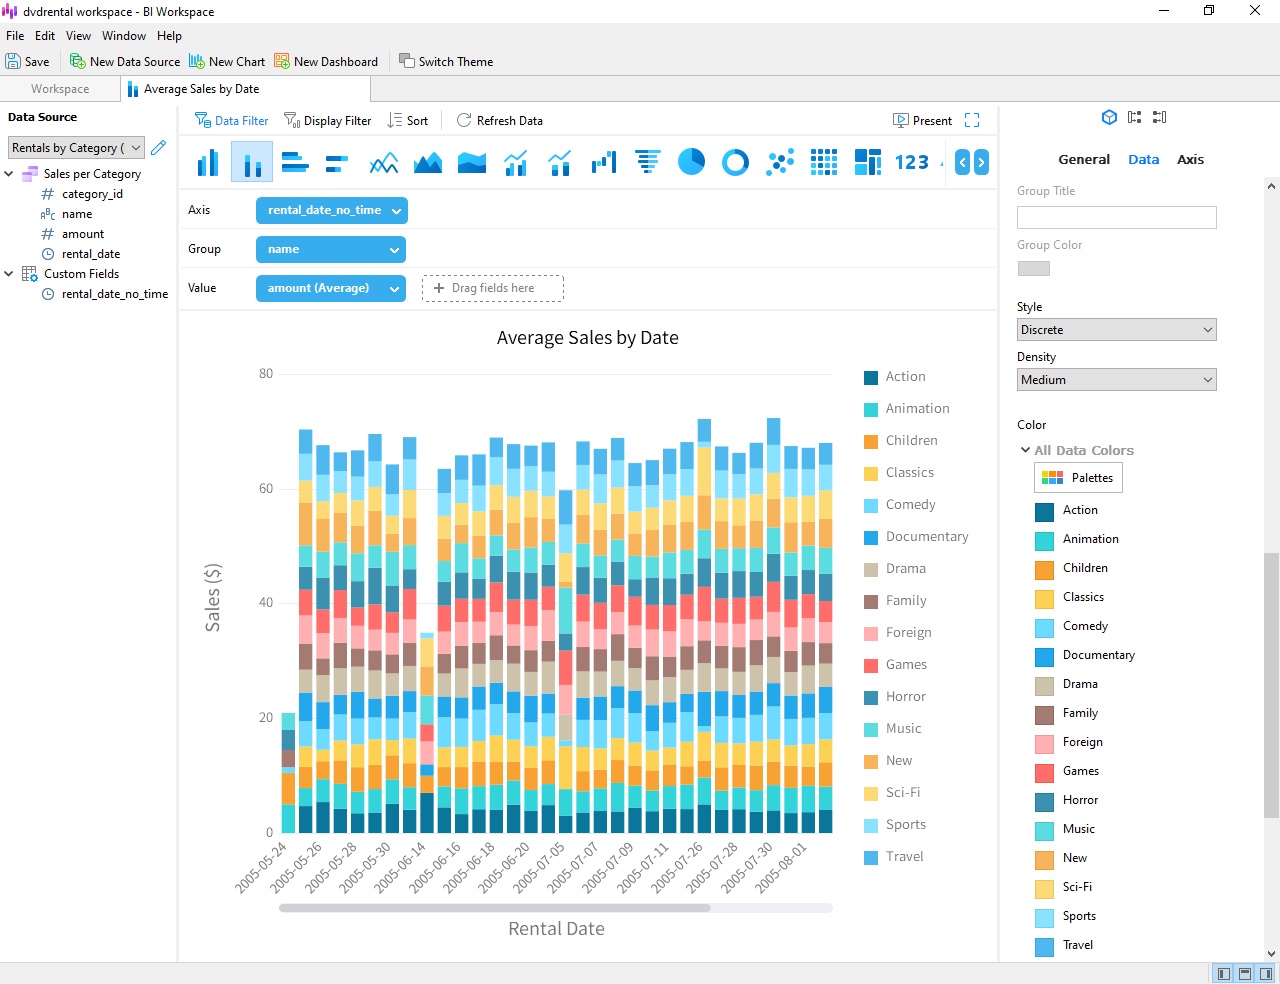
We can now use our new field in a chart. Here’s a Vertical Stacked Bar Chart that shows daily sales for each movie category:
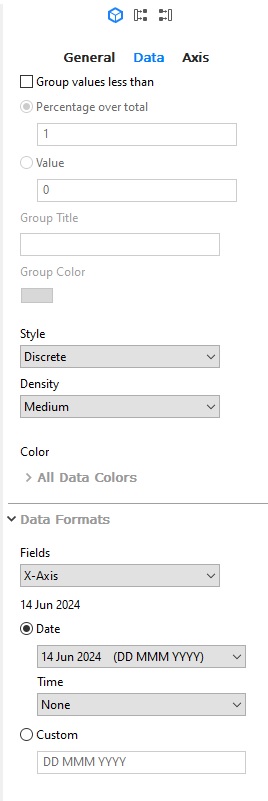
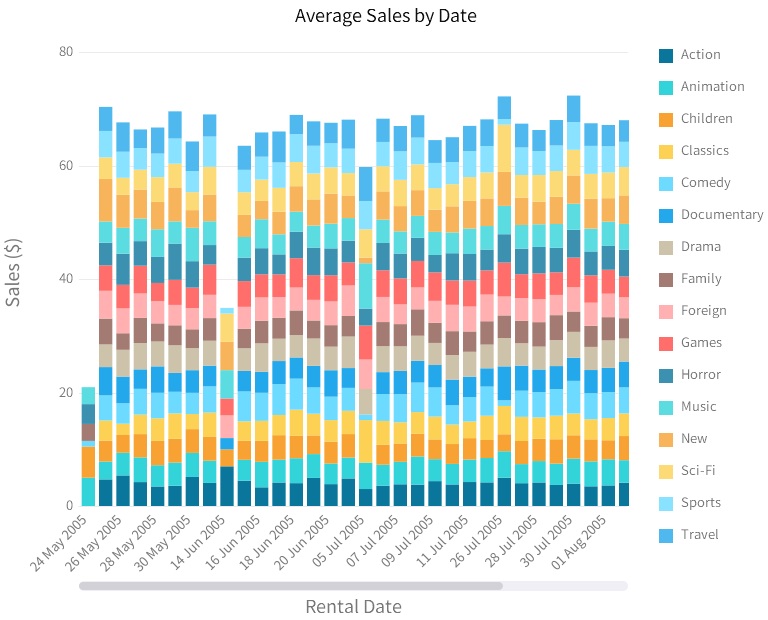
It should be noted that we further customize the format of Date and Time fields in the chart itself. For instance, we could change the dates to a “DD MMM YYYY” format by selecting it from the Date Formats section of the Data properties:
The new format will be immediately reflected in the chart:
This blog covered how to use Type-Changed Fields in your Navicat BI data sources. It is one of five custom field types, which include: Type-Changed, Concatenated, Mapped, Custom-Sorted, and, Calculated. Over the next several weeks, we’ll go over each of the remaining four custom field types.
You can download Navicat BI for a 14-day fully functional FREE trial. It’s available for Windows, macOS, and Linux operating systems.
